I realise this artist has been added before but thought this work was very different from the other.
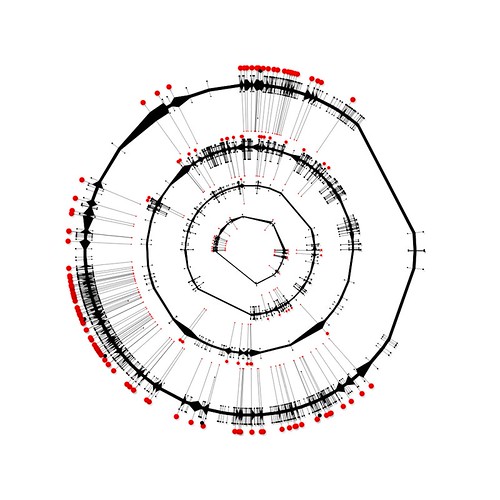
This work is more concerned with a kind of mapping...after a visit to Antartica Drury 'mapped' or documented 'data' using echogram technology.
'The ice here is over 4 km. deep and the underlying Earth is hot, so a lake has formed. each line of biro represents over a hundred  years in time and accumulation. Antarctica has been covered with ice for around 900,ooo years, which is about the time man has been on the Earth. An echogram, which is a radar image bounced through the ice from an aircraft and imaged in a computer. The image itself can be 20 m. or so long'. An interesting and visual use of data!!!
 years in time and accumulation. Antarctica has been covered with ice for around 900,ooo years, which is about the time man has been on the Earth. An echogram, which is a radar image bounced through the ice from an aircraft and imaged in a computer. The image itself can be 20 m. or so long'. An interesting and visual use of data!!!